Latest insights
Inflated Solar Savings Promises: How to Tell If Your Quote Was Built on False Numbers
Inflated Solar Savings Promises: How to Tell If Your Quote Was Built on False Numbers
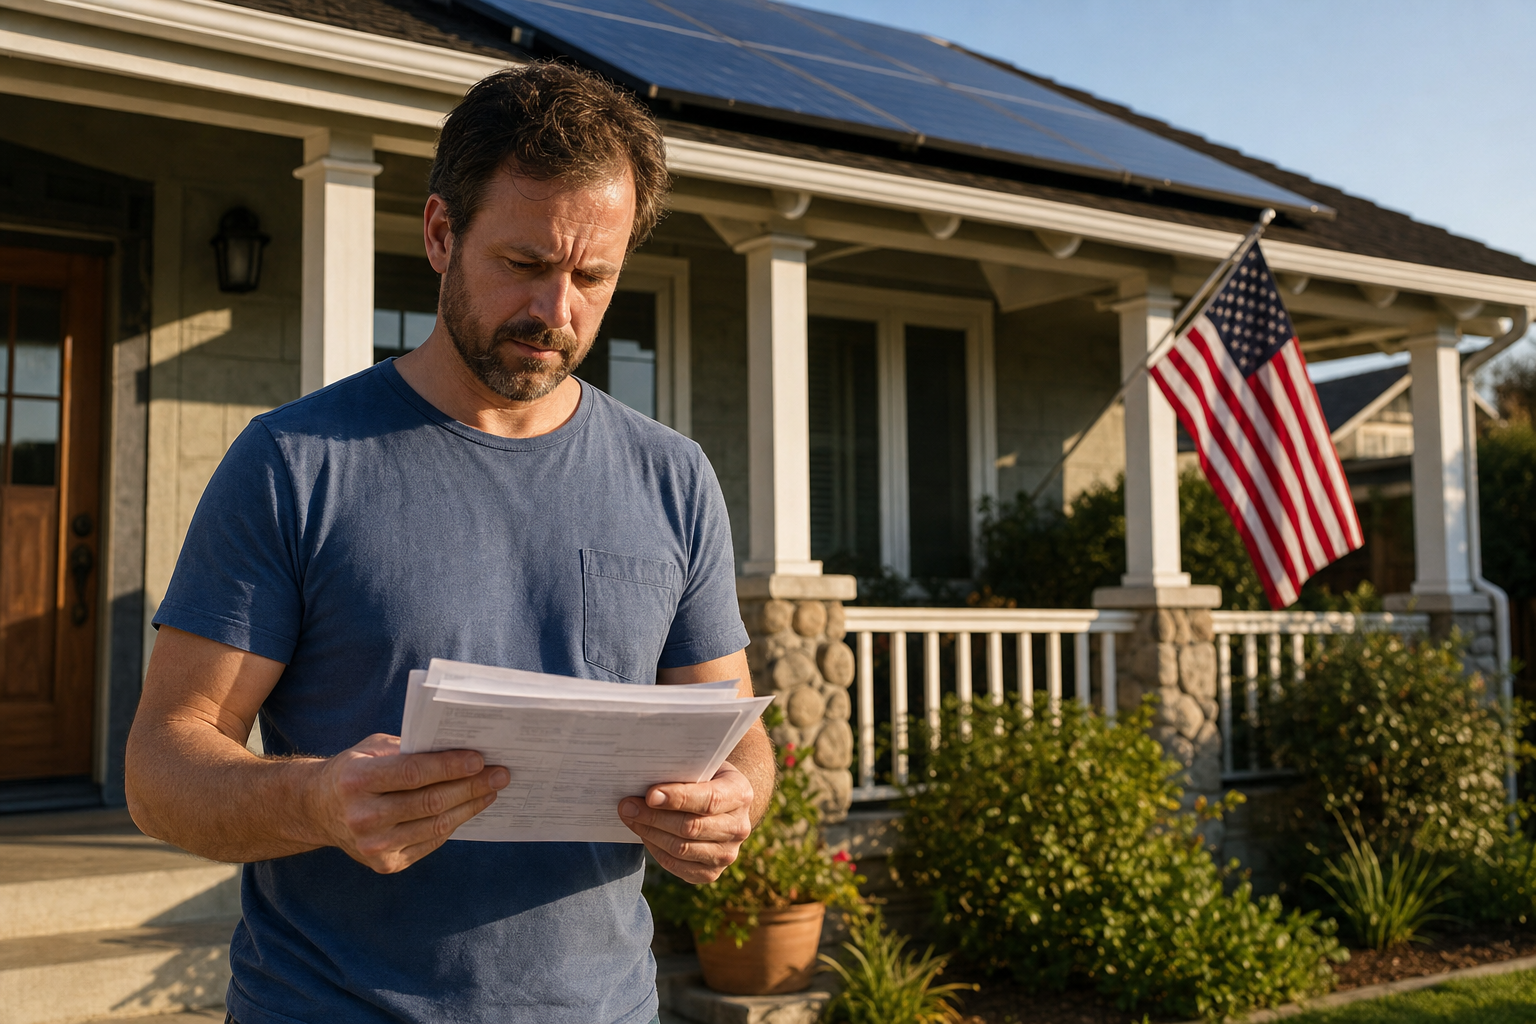
The salesperson sat at your kitchen table, pulled up a projection, and showed you exactly how much you'd save — $150 a month, maybe $200. Your utility bill would drop dramatically. The system would essentially pay for itself.
For a significant number of California homeowners, none of that came true.
Inflated savings promises are the most common solar complaint filed with state attorney general offices across California, and they follow a remarkably consistent pattern. Understanding how these projections get built — and how to check yours against reality — is the first step toward knowing whether you have a case.
How the Projection Gets Built
Solar savings estimates are not random. They're constructed from a series of inputs — and each one can be manipulated, intentionally or not, to produce a number that looks better than reality will deliver.
Peak sun hours — the number of hours per day your roof receives optimal sunlight. Salespeople often use the highest regional estimate rather than the actual number for your roof's orientation, pitch, shading, and microclimate. A south-facing roof in Fresno gets more peak sun hours than a west-facing roof in Daly City. Using the regional maximum for every roof inflates projected production.
System production — derived from peak sun hours multiplied by system size. If the sun hours input is inflated, every production number downstream is wrong.
Utility rate escalation assumptions — many projections assume your utility rates will increase 5–7% per year for 25 years. If rates stabilize or increase less than projected, the "savings vs. grid" comparison shrinks significantly. Under NEM 3.0 in California, the economics shifted dramatically for systems installed after April 2023 — salespeople using pre-NEM 3.0 projection models on post-NEM 3.0 contracts were showing customers fundamentally incorrect numbers.
PPA and lease escalators — if your contract includes an annual escalator of 2.9–3.5%, that payment grows every year whether your utility rate does or not. A projection that shows savings in year one may show you paying more than grid power by year eight or ten. Many projections shown at signing don't model this comparison honestly.
The Test: Are You Paying More Now Than Before?
This is the clearest diagnostic available to any California homeowner:
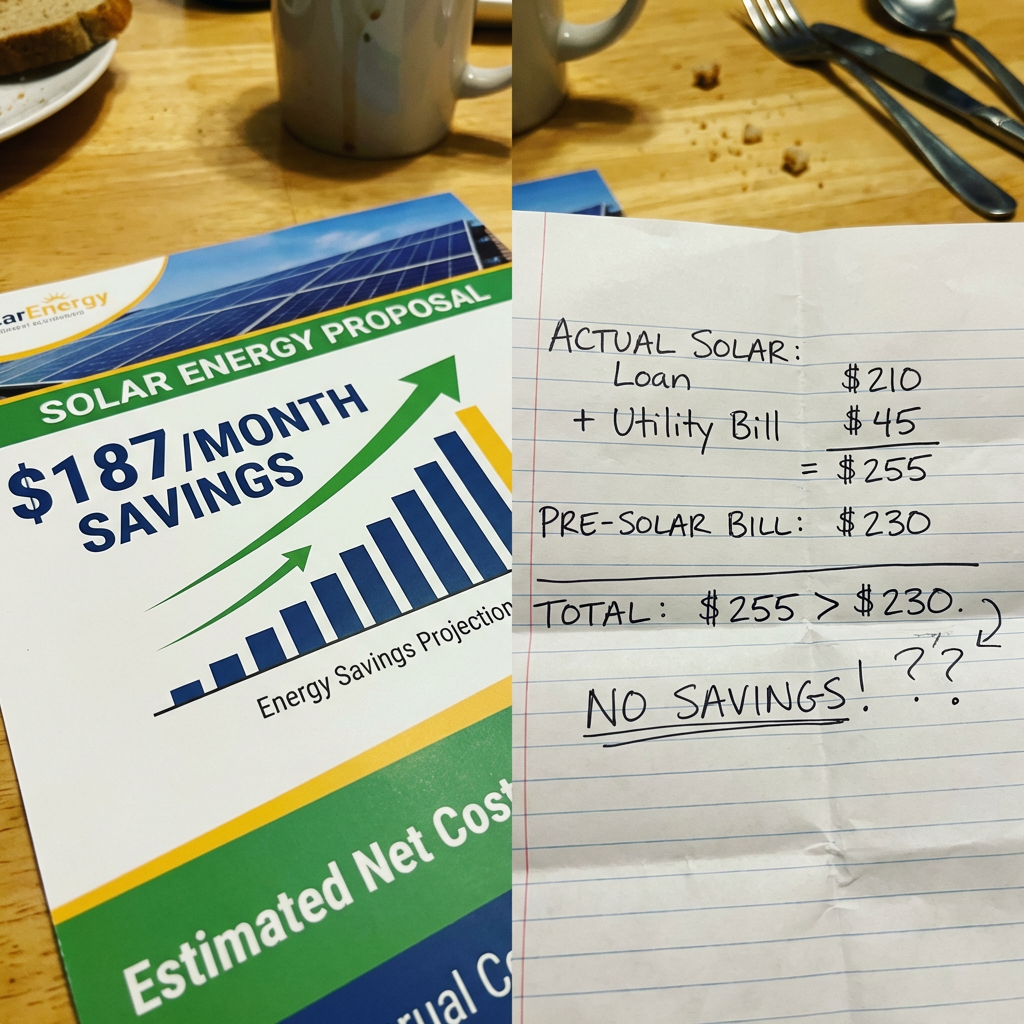
Add your current monthly solar payment (loan, lease, or PPA) to your current monthly utility bill. Compare that total to your average monthly utility bill for the 12 months before installation.
If the combined total is higher than your pre-solar bill, the savings claim was false — regardless of what the projection showed.
This comparison is the foundation of a misrepresentation claim under California's Unfair Competition Law (Business and Professions Code Section 17200) and UDAP statutes. The question isn't what the projection said. The question is whether the projection was an honest estimate or a number engineered to close a sale.
What "Best Case" Looks Like vs. What Was Promised
Here's how inflated projections typically diverge from real outcomes in California:
Shading and obstructions — a tree that partially shades your roof in the afternoon can reduce production by 10–25%. If the salesperson modeled your system without accounting for it, the production numbers are wrong from day one.
System degradation — solar panels lose roughly 0.5–0.8% of production capacity per year. A 25-year projection that doesn't account for degradation overstates lifetime production by 12–20%.
NEM 3.0 export rates — under the new net billing tariff that replaced NEM 2.0 in April 2023, the value of excess solar energy exported to the grid dropped by approximately 75% for most California utilities. Homeowners sold systems in 2022 with projections showing robust export credit income are now receiving a fraction of that value.
Grid connection delays — some California homeowners waited 6–18 months after installation for utility interconnection approval. During that period, the system couldn't export to the grid — but loan and lease payments were already running.
Frequently Asked Questions
Is an inaccurate savings projection automatically fraud? Not automatically — projections involve estimates, and honest estimates can be wrong. What crosses into misrepresentation is using inflated inputs knowingly, failing to disclose the assumptions behind the numbers, or presenting a best-case scenario as a guaranteed outcome. California's UDAP statutes don't require intent — an unfair or misleading business practice can be actionable even without deliberate deception.
What if the contract has a disclaimer saying savings aren't guaranteed? Fine-print disclaimers don't automatically shield a company from misrepresentation claims if the verbal sales pitch made specific promises. California courts have found that oral representations made during a sale can be actionable even when a written disclaimer exists.
How far back can I go with a claim? California's statute of limitations for unfair business practices under Business and Professions Code Section 17200 is four years from when the violation occurred or was discovered. For some homeowners whose systems have been underperforming for years, the clock may not have started until they realized the savings weren't materializing.
What documents do I need to evaluate my claim? Your original sales proposal or savings projection, your signed contract, your solar monitoring app data showing actual production, and 24 months of utility bills before and after installation. Together these tell the complete story of what you were promised versus what you received.
Think your savings projection was inflated? Book a free consultation or call (213) 579-5156. We review contracts and production data across all of California — remote consultations available.
Other insights
More from California Solar Exit